The boundary crosswalk and school neighborhood data sets can be downloaded here:
Construction of the dataset
To assemble our dataset, we calculate public charter school and out-of-boundary participation rates by school boundary using DME’s dataset and assign Census Block Groups to school boundary neighborhoods to create a dataset of neighborhood level characteristics. All rates and percentages are expressed on a scale of 0 to 100 (not 0 to 1).
School participation rates
To evaluate boundary participation rates, we use DME’s dataset of Public School Enrollments per DCPS Boundary for school year 2016-17 (Office of the Deputy Mayor for Education, 2017). The dataset already includes the boundary participation rate for each in-boundary school: the numerator is the number of in-boundary students enrolled at the school and the denominator is all grade-specific public school students living in the boundary.
Given the high level of school choice in D.C., we are also interested in public charter school and out-of-boundary DCPS participation rates—calculations that are not reported in the DME dataset. Furthermore, for privacy reasons, the DME does not report enrollment information if a school receives fewer than 10 students from a boundary neighborhood.[1] Therefore, we must use estimates.
For schools that enroll more than 10 students from a boundary neighborhood, the data are straightforward and students can be mapped to schools using the DME dataset. But this leaves behind students who cannot be mapped: this is the difference between the total number of public school students and the number of students reported as enrolled in a specific school. We apportion this remainder to either out-of-boundary DCPS schools or charter schools using the composition of schools with no reported students for that boundary neighborhood.
For example, if DME reports 100 students for a boundary neighborhood but reports school names for only 90 of them, we have 10 remaining students who we know attend public schools but we do not know which one. And if the dataset reports two public charter schools and three DCPS schools in the total school with repressed enrollment, we assume that the 10 would be attending these schools in the same three-to-two proportion with 4 of these students attending a public charter school and 6 attending an out-of-boundary DCPS school.
We repeat this process at the elementary, middle, and high school levels. For education campuses with elementary, middle, and high school grade bands, we break down the enrollment data across different levels using the grades they serve.
DETAILED CALCULATION OF PUBLIC CHARTER AND OUT-OF-BOUNDARY PARTICIPATION RATES
-
Number of students living in boundary but not reported as enrolled = Total number of students living in boundary – the total number of students who live in the boundary and are reported as attending a DCPS or public charter school
-
Number of schools with students attending that are not reported by name = Reported number of DCPS or public charter schools attended by grade-specific students living in the boundary - Sum of number of DCPS and public charter schools attended
-
Average number of students per school boundary attending schools that were not reported due to privacy = Number of students living in boundary who are not reported as attending a DCPS or public charter school due to privacy reasons (result from step 1) divided by the number of schools with students attending not reported by name (result from step 2)
-
Number of out-of-boundary or public charter school students who were not reported = Average number per school multiplied by the number of DCPS or public charter schools not reported
-
Rates of students attending out-of-boundary or public charter schools = Sum of reported and estimated not reported out-of-boundary DCPS and public charter school students divided by the total number of students living in boundary
Note: If more than one school is locate with a particular neighborhood, sum students for all schools to arrive at a neighborhood figure.
Building school boundary neighborhoods
We construct each school boundary out of Census Block Groups so that we can aggregate data from the ACS 5-year estimates and other sources to create a dataset of school boundary neighborhood characteristics.
ASSIGNING CENSUS BLOCK GROUPS TO SCHOOL BOUNDARY NEIGHBORHOODS
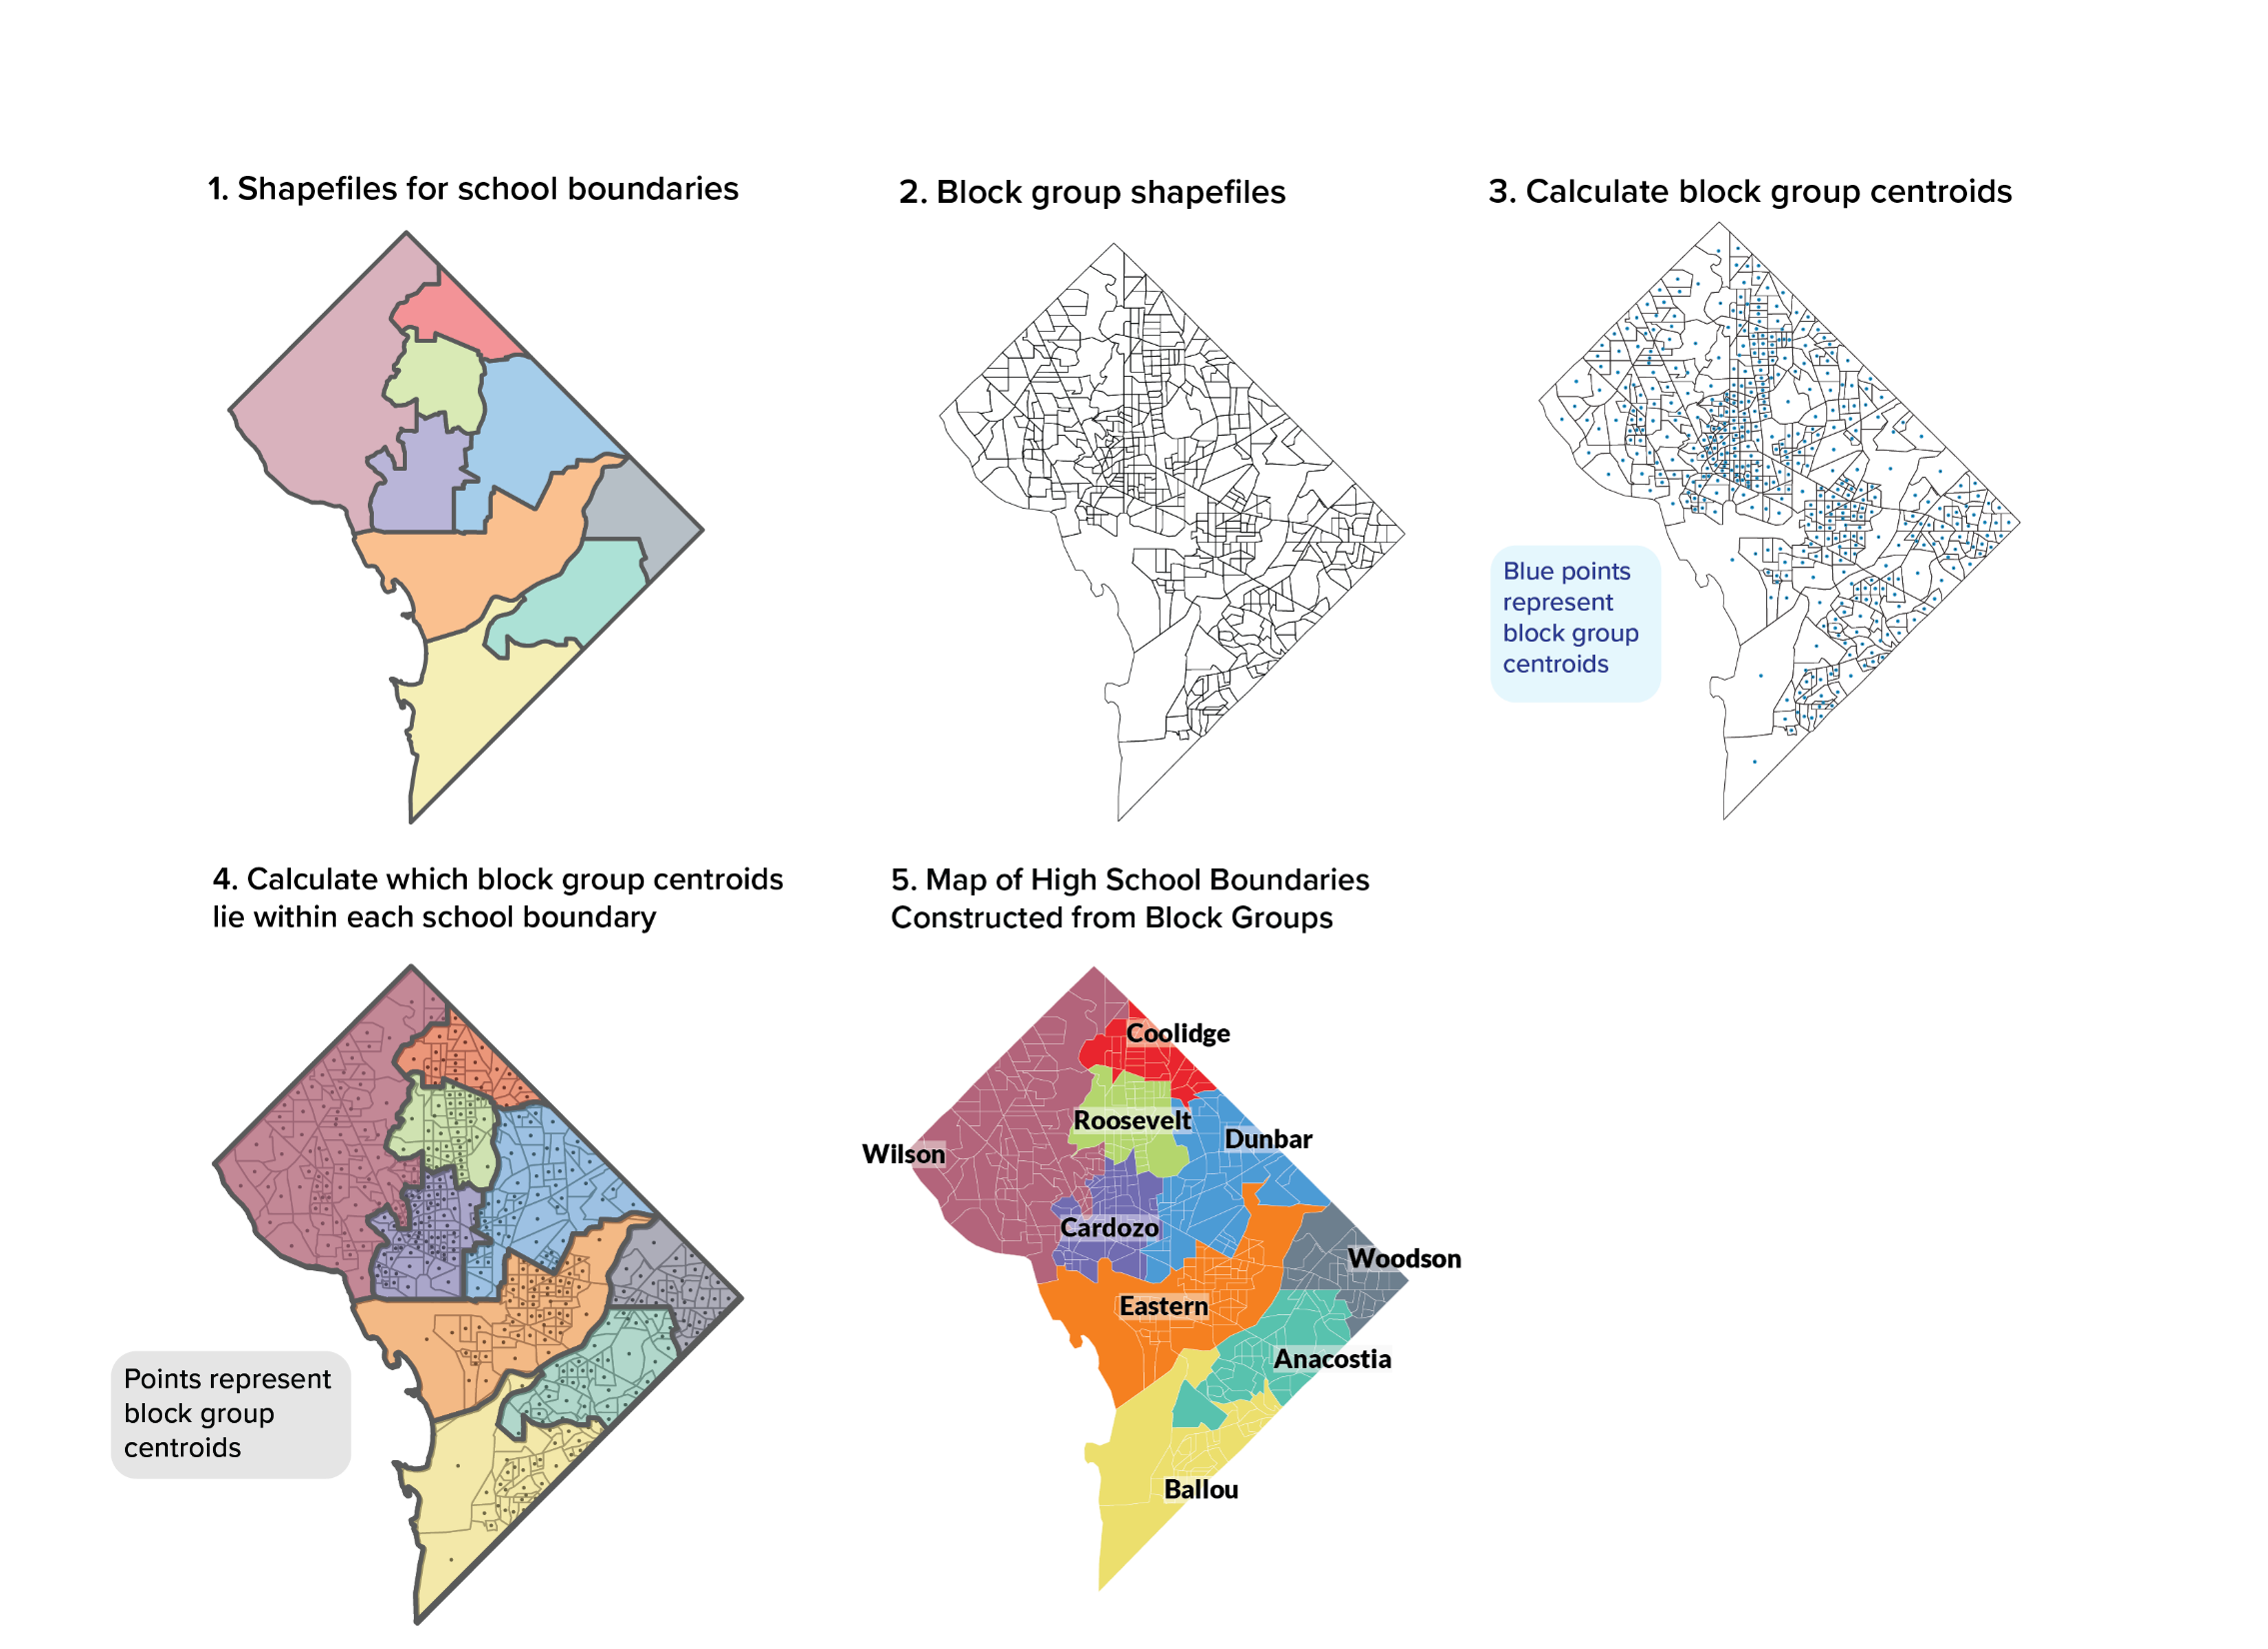
For our study, elementary, middle, and high school boundary neighborhoods are defined by aggregating Census Block Groups that fall in a school boundary. This builds on methodology from a recent Brookings study, “Balancing Act: Schools, Neighborhoods, and Racial Imbalance,” which uses Census Block centroids (geographic centers) to create school neighborhoods across the country depending on where the centroid falls (Whitehurst, Reeves, Joo, & Rodrigue, 2017). Using a similar approach, we assign Census Block Groups to D.C.’s actual school boundaries based on the location of the Census Block Group centroid.
We use Census Block Groups, the smallest unit of publicly available Census data, instead of census tracts or blocks to provide the closest possible fit. Washington, D.C. has 450 Census Block Groups for its 68 square miles, making the average Census Block Group 0.15 square miles in area. By comparison, there are 74 elementary school boundaries, making the average elementary school boundary size about one square mile. We did not divide the Census Block Group further to proportionately allocate populations because there is a risk that any additional precision in geography would be counterbalanced by higher error margins in neighborhood indicators. These constructed school boundary neighborhoods do not have perfect overlays with actual school boundaries, as some Census Block Groups are inevitably divided between two or more boundaries. However, using the smallest unit possible in combination with consistent rules for assigning groups provides the best possible approximation of school neighborhoods and their characteristics.
To create school boundary neighborhoods out of Census Block Groups, we first calculate centroids (geometric center) of each Census Block Group using the U.S. Census 2016 Cartographic Boundary shape files for D.C. (United States Census Bureau, 2016). Next, for each grade band, we join the school boundary shape file from the Office of the Chief Technology Officer (OCTO) with the Census Block Group centroids (DCGIS Open Data: Education, 2016).
Finally, we assigned a Census Block Group to a school neighborhood if the Census Block Group’s centroid falls within the school boundary. We repeat this at every level, creating 74 boundary neighborhoods at the elementary school level, 26 at the middle level, and nine at the high school level for a total of 109 neighborhoods for the District’s 109 in-boundary schools. Many Census Block Groups are matched to one school boundary, and all Census Block Groups are assigned to a boundary for each grade band. On average, there are six Census Block Groups in each elementary school boundary, 17 Census Block Groups in each middle school boundary, and 50 Census Block Groups in each high school boundary[2] . Methodology Figure 1 below shows a comparison of actual high school boundaries to the constructed areas for high schools.
METHODOLOGY FIGURE 1. HOW CENSUS BLOCK GROUPS AND CENTROIDS ALIGN WITH ACTUAL SCHOOL BOUNDARIES
MIDDLE SCHOOLS BOUNDARY DEFINITIONS
Available shape files for DCPS middle schools include three middle schools that were planned as part of the 2014 boundary school changes, but had not opened yet with in-boundary students as of school year 2016-17 (New North or Coolidge MS, Shaw MS, and MacFarland MS). We instead use boundaries for education campuses that served students in grades 6 to 8 within these areas, using the DCPS’s 2016-17 School Feeder Patterns as guidance (District of Columbia Public Schools, 2015). These education campuses were the in-boundary options available to students living in the to-be-established middle school areas. See methodology Table 1 for a full list of middle schools considered in our analysis.
METHODOLOGY TABLE 1. DCPS IN-BOUNDARY MIDDLE SCHOOLS AND EDUCATION CAMPUSES INCLUDED IN ANALYSIS
| Brightwood EC | LaSalle Backus EC |
| Brookland MS | McKinley MS |
| Browne EC | Oyster Adams Bilingual School |
| Cardozo EC | Raymond EC |
| Columbia Heights EC | School Without Walls at Francis Stevens |
| Deal MS | Sousa MS |
| Eliot Hine MS | Stuart Hobson MS Capitol Hill Cluster |
| Hardy MS | Takoma EC |
| Hart MS | Truesdell EC |
| Jefferson Middle School Academy | Walker Jones EC |
| Johnson John Hayden MS | West EC |
| Kelly Miller MS | Wheatley EC |
| Kramer MS | Whittier EC |
CREATING A DATASET OF NEIGHBORHOOD CHARACTERISTICS
Using the crosswalk that matches Census Block Groups to school boundaries, we pull data from 2011 and 2016 ACS 5-year estimates, MPD, DME, OSSE, WMATA, and DDOT and aggregate at the constructed school boundary level. ACS data reflect a representative sample of the population, therefore data reliability declines when we look at sub-populations. To determine what variables provide reliable estimates, we calculate and check margins of error when combining estimates to examine coefficients of variation, which compare the margins of error to the estimate value (United States Department of Commerce, 2009). For example, we are not able to use estimates of white or Hispanic/Latino population due to coefficients of variation that were above 0.30 for much of the sample. We also account for size differences in school boundary by dividing the number of public charter schools and transit stops by the square miles and the number of violent crime incidents by the number of residents.
COMPARING NEIGHBORHOOD DEMOGRAPHICS TO SCHOOL DEMOGRAPHICS
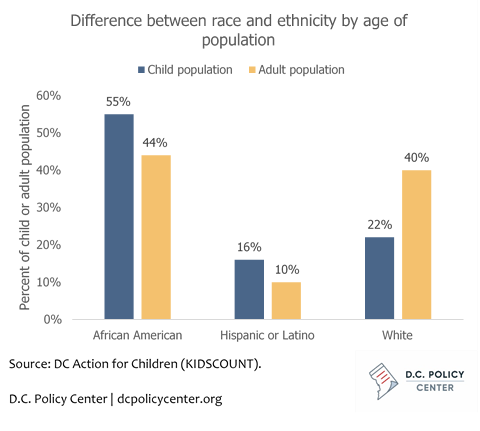
We are also interested in looking at how an in-boundary school’s demographic make-up is different from its boundary neighborhood. To do so, we compare the share of African American population in a neighborhood using ACS data to the share of African American students in a school using data from OSSE’s Equity Reports. Ideally, school enrollment should be compared to school-age population, but because of small sample size, we are not able to get a reliable estimate of the racial and ethnic composition of the school age population in each boundary neighborhood. But this approach gives a sense of own-group preference at the neighborhood level. For context, the child population is less white, more Hispanic/Latino, and more African American than the adult population (see Methodology Figure 2). This bias may affect some neighborhoods more than others, but our focus on neighborhood factors makes these differences in race and ethnicity by age relevant to our analysis.
METHODOLOGY FIGURE 2. A HIGHER PERCENTAGE OF CHILDREN ARE AFRICAN AMERICAN COMPARED TO ADULTS IN D.C.
Methodology
To conduct the analysis, we compare neighborhood characteristics to schools’ boundary participation rates using statistical tests of significance, examining correlations, and regression analysis. We identify neighborhood characteristics that are associated with school boundary participation and schools with higher boundary participation rates than expected given neighborhood characteristics. The methodology is described below.
1. Identify neighborhood characteristics that are associated with high boundary participation rates
With data ready on school participation rates and neighborhood characteristics, we first look at descriptive statistics for neighborhood characteristics of the in-boundary schools that have the highest boundary participation rates (75th percentile and above boundary participation rates) and compare them to other schools. We consider percent of population that is African American, percentage point change in population that is African American over the previous 5 years, own-group race/ethnicity preference (difference in the percent of the school neighborhood and school population that is African American), school-age population, percentage point change in population that is school-age over the previous 5 years, violent crime rates per 1,000 residents, number of metro and bus stops per square mile, percent of population above age 25 with a high school diploma, percent of households with incomes below the poverty level, percent of families headed by a single mother, percent of owner-occupied housing, and number of public charter schools per square mile. Using Welch’s t-tests for samples with unequal variances and sample sizes, we see if the schools with the highest boundary participation rates are in neighborhoods that are statistically different from others. Next, we check correlations between each neighborhood characteristic and boundary participation rate to see which characteristics are individually related to boundary participation.
We look at elementary schools separately from the group of middle and high schools because different neighborhood characteristics may influence school choices for younger students where the school boundary neighborhoods are smaller and the students might not travel as far. We also perform the same analysis for public charter school participation rates to see if different characteristics drive these choices.
2. Fit models with relevant neighborhood characteristics
With information on which characteristics are individually related to boundary participation, we run regressions of all the characteristics that have moderate or strong correlations [3] (positive or negative) with boundary participation rates on boundary participation to determine which neighbor-hood characteristics have a significant association for elementary, middle, and high schools when all factors are considered together. Next, we add an indicator variable for Wilson HS and its feeder schools because most of these schools have boundary participation rates that are extremely high. To check robustness of the model, we run a series of linear regressions to add quality[4], eliminate variables with a stepwise process, and remove variables that are collinear according to the variable inflation factor. We also look at standardized coefficients for continuous variables for our final model to evaluate which variables are the most important.
We perform the same analysis for public charter school participation rates to see if the key find-ings are aligned, and look at elementary schools separately from middle and high schools. In the main model, the dependent variable is boundary participation rates, and the independent variables are neighborhood characteristics with strong or moderate correlations to boundary participation:
In these equations, B is boundary participation rate, A is the percent of the population that is African American, C is the percentage point change in African American population from 2011 to 2016, M is the percent of family households that are headed by single mothers, V is the violent crime rate per 1,000 residents, I is the percent of households with income below the poverty level, E is the percent of population older than 25 with at least a high school diploma, S is the percentage point change in school-age population, and W is an indicator variable to designate schools within the Wilson HS boundary.
3. Identify school boundary neighborhoods that have higher or lower boundary participation rates than expected.
Finally, we predict boundary participation rates based on the best fit model. We then find the difference between each predicted and actual value, and identify schools that draw higher or lower proportions of in-boundary students than expected as those that lie outside the standard deviation for the difference. Any school already identified as a school that attracts the most or fewest students from its boundaries is excluded.
Footnotes
[1] About 20 percent of all public school students do not appear in the dataset because the group who live in a neigh-borhood and attend one school is smaller than 10 students.
[2] This crosswalk can be downloaded here. [.xlsx]
[3] Strong or moderate correlations are defined as any correlation coefficient with an absolute value between 0.40 and 0.59 for moderate and above 0.60 for strong (see J.D. Evans, Straightforward Statistics for the Behavioral Sciences).
[4] Although school factors are not the focus of our study, this check will show whether the Wilson effect persists when we account for student performance using a very rough measure of proficiency on the state assessment in mathematics.
References
-
Office of the Deputy Mayor for Education. (2017). Fact Sheet - Public Education Supply and Demand for the District of Columbia. Retrieved from Citywide Factsheets: https://dme.dc.gov/node/1200485
-
Whitehurst, G., Reeves, R., Joo, N., & Rodrigue, E. (2017, November). The Brookings Institution. Retrieved from Economic Studies at Brookings: https://www.brookings.edu/wp-content/uploads/2017/11/es_20171120_schoolsegregation.pdf
-
United States Census Bureau. (2016). Geography. Retrieved from Cartographic Boundary Shapefiles – Block Groups: https://www.census.gov/geo/maps-data/data/cbf/cbf_blkgrp.html
-
DCGIS Open Data: Education. (2016). DC Open Data. Retrieved from School Attendance Zones Shapefiles: http://opendata.dc.gov/datasets?q=school%20attendance%20zones
-
District of Columbia Public Schools. (2015, December 12). SY16-17 School Feeder Patterns. Retrieved from https://dcps.dc.gov/publication/sy16-17-school-feeder-patterns
-
United States Department of Commerce. (2009, May). A Compass for Understanding a Using American Community Survey Data: What Researchers Need to Know. Retrieved from:census.gov/…/ACSResearch.pdf